S&P 500 Concentration Risk Depends on Your FIRE Date
S&P 500 concentration risk is a sequencing problem for retirees, not accumulators. Sixty years of index churn shows why, plus the bond tent fix.

Roughly a third or more of a standard S&P 500 index fund now sits in its ten largest stocks, most of them AI plays, and every few weeks a new batch of charts warns that S&P 500 concentration risk has never looked worse. For a FIRE saver that warning lands differently than it does for a plain 401(k) investor, because your plan runs 50 to 70 years and ends with you selling, not buying. That asymmetry is the whole story. Across a horizon that long you never really hold the S&P 500; you hold a parade of structurally different portfolios sharing one ticker, and the churn is the return stream itself. The exposure worth pricing has a calendar attached: whether you begin withdrawals before or after a concentration peak deflates. Retirees who started spending at the 1972-73 or 2000 tops historically fared far worse than identical retirees who started once those peaks had deflated, while the same crashes enriched anyone still contributing. The correct response is a bond tent and a glidepath around your FIRE date, and it requires no opinion about AI at all.
Stay in the loop.
Get the latest posts and exclusive content delivered to your inbox.
Join 12 readers. No spam. Unsubscribe in one click, anytime.
What You Actually Bought in 1960
A 1960 newspaper business section that blogger Ben Carlson recently circulated lists the entire market of its day: 425 industrial companies, 25 railroads, and 50 utilities. That was the S&P 500, three years into its life. S&P expanded its old 90-stock average to 500 names in March 1957 with exactly that makeup, as S&P Global's own history recounts, and the dedicated rail quota tells you how alien that economy looks in hindsight. Trains were a sector you could be overweight in 1960 the way you can be overweight semiconductors today.
Even the labels are era-specific. GICS, the eleven-sector classification everyone now quotes, only dates to 1999, and its eleventh sector, real estate, did not arrive until 2016. A 1960 saver could not have asked what share of the index was technology, because the question had no category yet.
Stretch that to FIRE length and the conclusion is uncomfortable but freeing. Buy the index in 1960, hold fifty years, and the thing in your account is never one portfolio; it is dozens, and the price of collecting the full run of returns was holding through every regime change without flinching. Composition change was never a bug that arrived with AI; it is the product you bought.
Sixty Plus Years of S&P 500 Sector Rotation
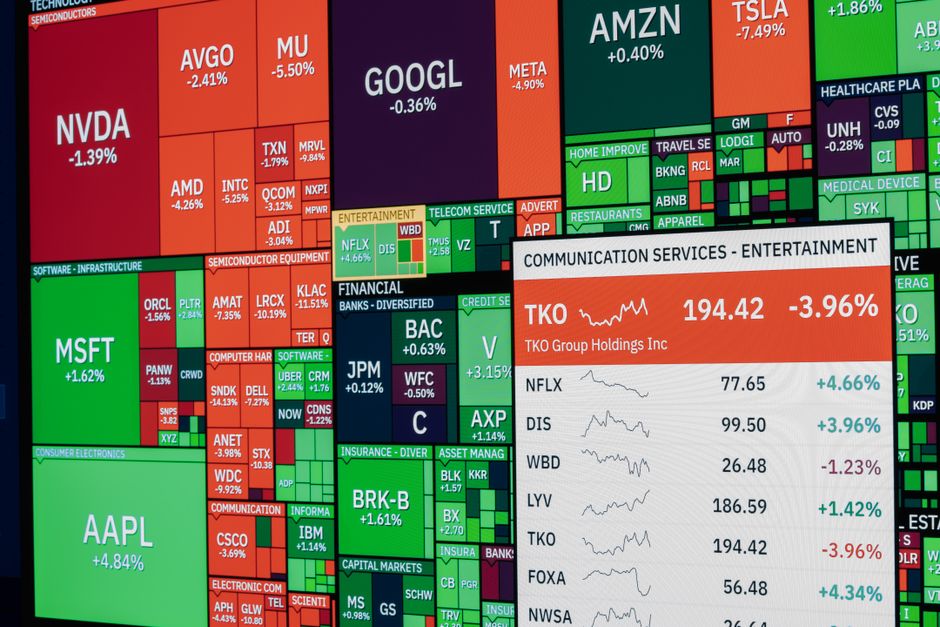
The sector composition history since 1957 is a catalog of leadership panics that all resolved the same way. Something comes to dominate the index, commentators declare a permanent new era, the weight peaks and rolls over, and leadership moves on.
| Era | Index leadership | Concentration marker |
|---|---|---|
| 1957 through the 1960s | rails, materials, industrials | 425 of 500 names were industrials by charter |
| by around 1980 | energy | energy reached roughly 30% of index weight after the oil shocks |
| 2000 | technology | tech reached about a third of index weight at the dot-com peak |
| 2007 | financials | banks and insurers pushed past 20% of index weight before the crisis |
| today | mega-cap AI and platforms | the top ten approach or exceed a third of index weight |
Weights are approximate, but the pattern is not. You can see the current standings in live SPY sector weightings, and long-run top-10 concentration data shows the biggest-names share sitting at the high end of its historical range. Every row was, in its own moment, called a regime break. Energy was supposed to own the index permanently after 1979, the Nifty Fifty made diversification look obsolete in 1972, banks were the new growth story in 2006. Concentration episodes recurred before every one of them, and the deflation that ended each episode was ordinary market history, not a failure of indexing.
How Cap Weighting Turns Churn Into Returns
Every era in that table ended with a deflation, and cap weighting is the machinery that executed it, with nobody ever voting to sell the leader. It is the only portfolio discipline that automatically trims a concentrated winner and buys the emergent names with zero decisions: when a leader inflates, its weight grows; when it deflates, the weight shrinks on its own, and the dollars quietly drift to whatever is compounding next. Energy's dominance did not end because someone at S&P called the top around 1980; it ended because the oil giants stopped outgrowing the rest of the market and their weights decayed. The same arithmetic, not an AI call, will deflate today's top-ten weight if these prices turn out to be a peak. If the earnings are real, the weight is earned. Either way, you already own the mechanism that resolves the episode.
This is also why a FIRE saver can trust a 50-to-70-year backtest despite constant turnover. Across that horizon you personally ride four to six complete composition regimes, and the committee's churn, a couple of dozen additions and deletions in a typical year, keeps the membership current while the weighting does the trimming and buying. The process, not any constituent list, is the durable asset, and it charges hundredths of a percent for the service. Trusting the backtest was always a bet on the process continuing to churn, never on a list of tickers surviving intact.
S&P 500 Concentration Risk Is Really Sequence Risk

Sequence of returns risk is the finding that order matters more than average for anyone who is withdrawing. A 7% average return delivered as boom-then-bust supports a very different retirement than the same average delivered as bust-then-boom. In the accumulation phase of FIRE the sequence runs in reverse, and it works for you.
Run the same crash through both cash-flow directions:
| Retiree withdrawing $40,000 a year | Accumulator adding $50,000 a year | |
|---|---|---|
| Starting balance | $1,000,000 | $200,000 |
| 40% drawdown hits | $600,000 | $100,000 |
| After one year of cash flow | $560,000, needing a 79% rebound just to restore $1M | $150,000, with new shares bought 40% below prior prices |
The retiree's withdrawals crystallize the loss; every distribution sells shares that never get to recover. The accumulator's contributions do the opposite: when annual savings are large relative to the balance, an early crash raises the lifetime dollar-weighted return, because most dollars enter at low prices. Same fund, same crash, opposite outcomes. What separates the two savers is the direction of their cash flow, not which stocks the index happened to overweight that year. That is why de-concentrating the portfolio attacks the wrong variable.
The Arithmetic of Retiring at a Concentration Peak
History ran this experiment twice in living memory. In 1972 the Nifty Fifty, a few dozen adored large caps, traded at multiples that assumed growth never stopped; the index lost roughly half its value across 1973-74. In 2000 technology stood about a third of the index at the peak. What followed split the two layers: the broad index lost roughly half through 2002, while the technology sector itself, the concentrated piece, fell far more, roughly three quarters from its highs. Cohorts that began 4%-style withdrawals at those tops land near the bottom of the rolling 30-year distribution, while cohorts that began after the deflation did materially better, even though the long-run average return was identical for everyone.
The 4 percent rule was built from exactly that graveyard. Bengen's original 1994 study defined the safe withdrawal rate by hunting the worst historical sequences, and the Trinity study mapped success rates across asset mixes and rolling periods, with later sequence research sharpening the point: outcomes are dominated by the first decade of withdrawals. The starting line, not year fifteen, is what decides.
Now point that lens at a FIRE date falling in the mid-2020s. Valuations sit well above long-run averages and top-ten weight is at or near the top of its historical range, the same two markers that defined 1973 and 2000. None of this schedules a crash, and AI earnings may justify the weights. The point is narrower: for anyone within a decade of their FIRE date, the cost of being wrong about AI is asymmetric; for anyone further out it is roughly symmetric. Pricing that asymmetry, not predicting it, is the job.
What Not to Do About AI Concentration
Every popular fix for AI stocks index concentration changes what you own, and none of them changes when your withdrawals begin. Since the second variable is the one that historically decided outcomes, audit each fix against it.
- Equal weight vs market weight S&P 500. Equal-weighting cuts single-name concentration but adds turnover, taxable events in a taxable account, a permanent small-cap tilt, and it still falls hard in the same macro drawdown. You would carry new risks and costs into the very crash you were trying to insure against.
- Sector tilts. Underweighting tech or AI is an active bet that you can call regime change better than the market can, which is the skill you retired when you bought the index.
- Picking the survivors. The entire appeal of cap weighting was letting churn pick the winners for free, across regimes you will not see coming.
- Exiting to cash. This converts sequence risk into shortfall risk and asks you to win a timing decision repeatedly rather than once.
So, should you worry about AI stock concentration in index funds? Only if you are within about a decade of selling. For an accumulator with time on their side, the worry costs performance and the churn is free.
The Bond Tent and Glidepath Near Your FIRE Number
The moves that matter are calendar-based. A bond tent is an asset allocation that rises toward safe assets before your FIRE date, peaks around it, and drains after the fragile first decade of withdrawals. You can read the full bond tents for early retirement playbook, but the design is simple: shift enough into bonds and cash, before and just after the FIRE date, to cover roughly five to ten years of planned withdrawals, a common planning range. After FIRE you spend from the tent and never sell equities into a drawdown. Once the first decade survives, you drift back toward equities on a rising equity glidepath, because worst-case outcomes historically cluster early, and a defensive start followed by re-risking addresses exactly that window.
| Phase | What to do |
|---|---|
| 10+ years from FIRE | Hold the index as-is and keep buying; crashes raise your lifetime return, composition headlines are noise |
| 5 to 10 years out | Pick a tent size, typically enough safe assets to fund 5 to 10 years of spending; no urgency to fill it yet |
| 0 to 5 years out | Ramp the tent up while contributions continue; by the FIRE date, safe assets should cover roughly a decade of withdrawals |
| FIRE to year 10 | Spend from the tent, never from depressed equities; let the equity sleeve compound untouched |
| Year 10 onward | If the sequence was kind, re-risk gradually and recheck your withdrawal rate against the balance that survived |
Notice what this plan does not contain: an opinion about AI. The 1980 retiree needed no oil forecast, and the 2000 retiree needed no dot-com call; the savers who got hurt were the ones whose plans required good luck in year one. The index will keep remaking itself, as it has since 425 industrials and 25 railroads gave way to energy, tech, banks, and now mega-cap platforms. Match the portfolio to the calendar, buy the churn while you accumulate, and armor the decade in which you sell. That is the entire fix for S&P 500 concentration risk.
Stay in the loop.
Get the latest posts and exclusive content delivered to your inbox.
Join 12 readers. No spam. Unsubscribe in one click, anytime.
About the author
Ethan Carter
Side-Income Writer
Ethan built his first profitable side hustle while working full-time and now runs several income streams alongside his day job. He covers career growth, freelancing, and the earning-more half of the FIRE equation, the part of the formula most people ignore.
Related Posts

Small-Cap Value Tilt vs Total Market for FIRE, in FI Months
A small-cap value tilt moves a 50% savings-rate FI date by barely a year, and it deepens early-retirement drawdowns. See the trade-off priced in FI months.

Rental Properties vs Index Funds Priced as a Second Job
Rental properties vs index funds, priced as a job. Tally landlording's real hours, compute the implicit hourly wage, and check when rentals win.

Stock Picking vs Index Funds? A 5% Answer for FIRE
A capped 5% speculation sleeve settles stock picking vs index funds for FIRE. Total loss costs months, not years, and the rulebook keeps it that way.